My college football model ranks all 138 FBS teams after every week and picks every game before kickoff. Every team and every pick is on the live power rankings page, and here's how this is made.
Week 8 at a glance
- No. 1: Notre Dame (6-1), up from No. 2.
- Game of the week: No. 8 Ole Miss at No. 10 Texas. The model gives Texas a 55% chance.
- Texas is No. 10 and a 55% favorite against Ole Miss.
- Biggest disagreement with the AP poll: SMU, No. 40 in the model and No. 23 in the AP.
- Last week: I picked 33 of 52 winners (63%).
- Model update: Success rate, recruiting and a longer test (details).
Jump to: The top 25 · Game of the week · Forty Acres Report · SMU · Playoff picture · Other games
Week 8 power rankings: the top 25
Rank is the model's power rating: who would be favored on a neutral field next week, not who has the best résumé. Opponent ranks are the model's too. The AP poll and the betting market's ranking (teams rated from this season's point spreads, weighted toward recent weeks) are there for comparison.
| Rank (prev.) | Team | Record | This week (win %) | AP poll | Vegas |
|---|---|---|---|---|---|
| 1 (2) | Notre Dame | 6-1 | Bye | 4 | 1 |
| 2 (4) | Miami | 6-0 | vs. Pittsburgh (91%) | 1 | 4 |
| 3 (1) | Alabama | 5-2 | vs. Texas A&M (85%) | 13 | 9 |
| 4 (8) | LSU | 5-2 | at Auburn (77%) | 18 | 10 |
| 5 (3) | Georgia | 6-1 | Bye | 5 | 5 |
| 6 (5) | Ohio State | 6-1 | Bye | 3 | 2 |
| 7 (6) | Indiana | 6-1 | at Michigan (75%) | 6 | 3 |
| 8 (18) | Ole Miss | 5-1 | at No. 10 Texas (45%) | 7 | 12 |
| 9 (9) | Utah | 6-0 | vs. No. 17 Houston (62%) | 10 | 13 |
| 10 (7) | Texas | 4-2 | vs. No. 8 Ole Miss (55%) | 19 | 8 |
| 11 (11) | Texas Tech | 6-0 | at Cincinnati (79%) | 8 | 7 |
| 12 (17) | Tennessee | 6-1 | at South Carolina (63%) | 11 | 23 |
| 13 (14) | BYU | 6-0 | at UCF (72%) | 2 | 19 |
| 14 (22) | Wake Forest | 6-1 | Bye | 17 | 30 |
| 15 (16) | Oregon | 4-2 | at Illinois (79%) | NR | 6 |
| 16 (10) | UCLA | 6-0 | vs. Michigan State (85%) | 9 | 43 |
| 17 (15) | Houston | 6-1 | at No. 9 Utah (38%) | 14 | 28 |
| 18 (13) | Nebraska | 5-2 | Bye | NR | 16 |
| 19 (35) | Iowa | 5-1 | at Minnesota (79%) | 15 | 24 |
| 20 (24) | USC | 6-1 | at Wisconsin (55%) | 16 | 11 |
| 21 (27) | Kentucky | 6-1 | vs. Vanderbilt (87%) | 12 | 37 |
| 22 (12) | Missouri | 5-2 | Bye | 22 | 26 |
| 23 (20) | Arizona | 5-1 | vs. Iowa State (76%) | 25 | 29 |
| 24 (21) | Northwestern | 5-1 | vs. Rutgers (87%) | 24 | 33 |
| 25 (32) | Louisville | 4-3 | Bye | NR | 22 |
- Injury adjustment: Pittsburgh: starting quarterback Mason Heintschel tore the ACL in his right knee against Virginia Tech on Oct. 2 and is reported to be out for the season. Holden Geriner has started since, and Pat Narduzzi said he remains the starter (Field Level Media (citing ESPN), Field Level Media). The model takes 2.0 points off Pittsburgh's rating for it, half the gap between the two quarterbacks' numbers, the share that best predicted results when starters missed games in 2024 and 2025.
- Injury adjustment: Ohio State: starting quarterback Julian Sayin hurt his throwing arm in the fourth quarter of the Indiana game, and Ryan Day said he is likely out for several weeks. Freshman Luke Fahey replaced him in that game; Ohio State has a bye before USC on Oct. 31 (ESPN, Athlon Sports). The model takes 4.5 points off Ohio State's rating for it, half the gap between the two quarterbacks' numbers, the share that best predicted results when starters missed games in 2024 and 2025.
- Not in the model: Texas: All-American edge rusher Colin Simmons, Texas's leading pass rusher, was carted off in the fourth quarter of the Florida loss with a lower-leg injury. One report called it an ankle sprain; Steve Sarkisian didn't know the extent yet and is expected to update his status Monday, so whether he plays Ole Miss is unknown (AP, Sports Illustrated, Burnt Orange Nation). The model can't price this one; the Vegas line usually does.
- Injury adjustment: Illinois: starting quarterback Katin Houser had a procedure on his throwing hand after hurting it in the Michigan State game, and Bret Bielema said he is expected to miss four to six weeks. Michael Clayton II, who threw the winning touchdown in overtime of that game, is expected to start (Field Level Media). The model takes 3.1 points off Illinois's rating for it, half the gap between the two quarterbacks' numbers, the share that best predicted results when starters missed games in 2024 and 2025.
- Injury adjustment: UCLA: starting quarterback Nico Iamaleava is out for the season with a knee injury from the Oregon game, and Ty Dieffenbach, who took over in that game's second half, is expected to start. The model's UCLA rating is built on games Iamaleava started (ESPN). The model takes 1.1 points onto UCLA's rating for it, half the gap between the two quarterbacks' numbers, the share that best predicted results when starters missed games in 2024 and 2025.
Where the betting market disagrees most: I'm 10 points higher on UCLA (No. 16 here, No. 43 in Vegas); 8 points higher on Wake Forest (No. 14 here, No. 30 in Vegas); 8 points higher on Tennessee (No. 12 here, No. 23 in Vegas). When my numbers and the Vegas line have disagreed by 6 or more points on a game, the line has been closer to the final margin 60% of the time, so treat these as my boldest calls.
The top five are separated by about 4 points, so No. 1 is up for grabs every week. Ratings, projections and playoff odds for every team are on the live page.
Head-to-head check: these ratings cover whole seasons, so a team can sit above one that beat it.
- Notre Dame (No. 1) over BYU (No. 13): BYU won 28-24 at home in week 7, but over the whole season Notre Dame rates 8.8 points better. Its run defense ranks No. 3 of 138.
- Alabama (No. 3) over Georgia (No. 5): Georgia won 20-17 on the road in week 6, but over the whole season Alabama rates 1.3 points better. Its run defense ranks No. 6 of 138.
- Alabama (No. 3) over Tennessee (No. 12): Tennessee won 26-10 at home in week 7, but over the whole season Alabama rates 6.5 points better. Its run defense ranks No. 6 of 138.
Model update this week
Success rate, recruiting and a longer test. Six changes, each kept only because it improved predictions on seasons it wasn't tuned on. Efficiency now includes success rate (the share of plays that keep an offense on schedule) alongside EPA per play, and it was the biggest single gain. Big wins still count more than close ones, but with diminishing returns instead of a hard cap at 28 points. FCS teams are rated one by one, so beating a strong FCS team counts for more than beating a weak one. Recent games count a little more than September's. Each team's efficiency starts from last season's instead of from average. And the preseason rating now uses recruiting and coaching changes (about 1.4 points off for a new head coach). The test now covers 2018 through 2025 (2020 skipped), 4,180 games from week 4 on: the average miss fell from 12.63 to 12.47 points, against 12.11 for the Vegas closing line, and the model picked 73.0% of winners to Vegas's 72.8%. It improved in all seven seasons. In weeks 1-3 the miss fell from 13.60 to 13.25. The preseason rating still fades on the same schedule as before. A stronger midseason pull toward preseason expectations would have tested slightly better, but it would put teams like 3-2 Oregon back above the 5-0 UCLA team that beat them, and these rankings should come from this season's games. Week 7 picks were locked on the previous model and are graded as published.
Game of the week: Ole Miss at Texas pick and preview
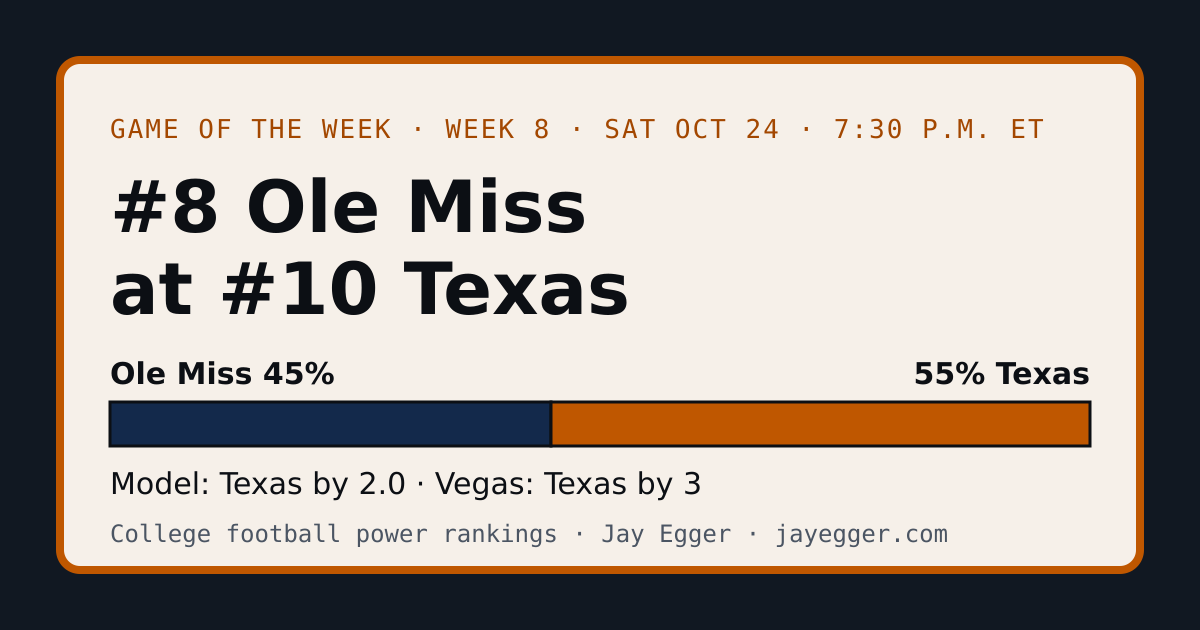
The pick: Texas by 2.0 (55%). Vegas has Texas by 3. Saturday at 7:30 p.m. ET on ABC.
Not in the model: Texas: All-American edge rusher Colin Simmons, Texas's leading pass rusher, was carted off in the fourth quarter of the Florida loss with a lower-leg injury. One report called it an ankle sprain; Steve Sarkisian didn't know the extent yet and is expected to update his status Monday, so whether he plays Ole Miss is unknown (AP, Sports Illustrated, Burnt Orange Nation). The model can't price this one; the Vegas line usually does.
What's at stake: Texas's playoff odds are 59% with a win and 23% with a loss; Ole Miss's are 71% and 36%.
The series: Texas leads the all-time series 6-2. Last meeting: Ole Miss won 44-23 at Texas in 2013.
In the news: Ole Miss: Ole Miss is in its first season under Pete Golding, promoted after Lane Kiffin left for LSU, and the Rebels beat Kiffin's LSU 32-24 in Oxford in September (Sports Illustrated).
How each team wins
Unit ranks are out of 138 FBS teams.
- Texas: Its biggest edge is its passing offense (No. 59) against Ole Miss's pass defense (No. 83).
- Ole Miss: Its biggest edge is its run defense (No. 80) against Texas's rushing offense (No. 96). Another advantage: its passing offense (No. 9) against Texas's pass defense (No. 22).
Based on how they've played (postgame win probability), Ole Miss would usually be about 4-2 and Texas about 3-3. Ole Miss's 5-1 is a little better than its play, and Texas's 4-2 is a little better than its play.
Players to watch
- Ole Miss
- QB Trinidad Chambliss: 1,676 yards, 14 TD, 4 INT (efficiency: No. 11 of 124 FBS quarterbacks)
- Top rusher Kewan Lacy: 352 yards, 5 TD
- Top receiver Deuce Alexander: 35 catches, 523 yards, 5 TD
- Pass rusher Blake Purchase: 3.5 sacks, 6.5 tackles for loss
- Texas
- QB Arch Manning: 1,298 yards, 11 TD, 5 INT (efficiency: No. 55 of 124 FBS quarterbacks)
- Top rusher Daylan Smothers: 289 yards, 2 TD
- Top receiver Ryan Wingo: 26 catches, 345 yards, 3 TD
- Pass rusher Colin Simmons: 10 sacks, 15.5 tackles for loss
Forty Acres Report: Texas vs. Ole Miss pick and preview
Full disclosure: I'm a Texas fan, so this section shows up every week. The model doesn't care.
The pick: Texas by 2.0 (55%). Vegas has Texas by 3. Saturday at 7:30 p.m. ET (6:30 p.m. in Austin) on ABC. Ole Miss at Texas is also the game of the week; its full preview is above.
Where Texas stands
Texas is No. 10 in the model, down from No. 7, and No. 19 in the AP poll. Its path this season: 7, 10, 7, 7, 6, 7, 10 (rankings before week 7 were rebuilt after launch). It spent 4 weeks at No. 1 in the AP poll; the model's best ranking for Texas has been No. 6.
In the news: After the 27-24 loss to Florida, Texas's second straight after four weeks at No. 1 in the AP poll, Steve Sarkisian said everything would be evaluated, and when asked whether that included the quarterback, he said it covered everything (AP).
Based on how it has played, Texas would usually be about 3-3, so its 4-2 record is a little better than its play. Playoff odds: 43% to make the 12-team field, 2% to win the SEC, 2% to win it all (more on the Texas page).
The Arch Manning question
Arch Manning came back to Texas for 2026 as a preseason Heisman co-favorite, but after two fourth-quarter interceptions against Oklahoma and a fumble on the final drive against Florida, Steve Sarkisian would not rule out a quarterback change (Heisman odds, Yahoo Sports, NBC Sports). So far the numbers haven't matched the billing: Manning is in the middle third of FBS quarterbacks in efficiency, adjusted for opponents (No. 55 of 124), with 11 touchdowns and 5 interceptions. His line hasn't made it easier: Texas allows a sack on 9.3% of dropbacks, No. 128 of 138 in FBS (sacks reflect the quarterback too). His Florida game graded out below average once the defense is accounted for.
Last week: the 27-24 loss to Florida
Expected points added (EPA) measures how much each play changed a team's chances of scoring; "adjusted" accounts for the defense it came against.
- Arch Manning (14/20 for 173 yards, 1 TD, 0 INT): A below-average game for a quarterback against the No. 69 pass defense. That's below his usual level. Expected points per dropback: 0.03 raw, 0.04 adjusted for the defense.
- Emmett Mosley V (2 catches for 76 yards)
- Daylan Smothers (12 carries for 52 yards): One of the week's weaker games for a runner against the No. 43 run defense. Expected points per carry: −0.41 raw, −0.38 adjusted for the defense.
- Colin Simmons (8 tackles, 4 for loss, 1 sack)
The season so far
| Opponent | Their defense | Texas offense, raw | Adjusted for the defense |
|---|---|---|---|
| Texas State | No. 86 | 0.31 | 0.28 |
| Ohio State | No. 5 | 0.07 | 0.28 |
| UTSA | No. 60 | 0.00 | 0.03 |
| Tennessee | No. 6 | 0.06 | 0.26 |
| Oklahoma | No. 16 | 0.03 | 0.18 |
| Florida | No. 52 | −0.13 | −0.09 |
Numbers are expected points added (EPA) per play. Even adjusted for the defenses, the offense has slipped. Over the last three games it averages 0.11 adjusted, against 0.19 before.
Up front: Texas allows a sack on 9.3% of dropbacks (No. 128 of 138; that's the line and the quarterback together) and gets stuffed at or behind the line on 15% of runs, adjusted for the defenses it has faced (No. 76).
Season leaders:
- Top rusher Daylan Smothers: 289 yards, 2 TD
- Top receiver Ryan Wingo: 26 catches, 345 yards, 3 TD
- Pass rusher Colin Simmons: 10 sacks, 15.5 tackles for loss
SMU: the model's argument with the AP poll
SMU is No. 23 in the AP poll but only No. 40 in the model. Here's why:
- The record: by résumé (wins above what a typical top-25 team would expect on its schedule), SMU ranks No. 29, which is what voters are rewarding.
- The play: based on how it has played, SMU would usually be about 5-1.
- The weak spot: its rushing offense ranks No. 101 of 138.
- This week: California at SMU. The model has SMU by 15.8 (84%); Vegas has SMU by 17.5, so the betting market is even higher on SMU than I am.
- The real test: at No. 1 Notre Dame in week 12, where the model gives SMU a 9% chance.
- Playoff odds: 4%.
- Quarterback: Kevin Jennings, 1,859 yards, 16 TD, 5 INT, No. 28 of 124 FBS quarterbacks in efficiency.
Risers and fallers
- Up: TCU (+17 to No. 29, after winning 17-6 at Baylor); Iowa (+16 to No. 19, after winning 41-24 at Washington); Ole Miss (+10 to No. 8, after beating Missouri 31-3).
- Down: Mississippi State (−15 to No. 34, after losing 31-0 at LSU); Missouri (−10 to No. 22, after losing 31-3 at Ole Miss); James Madison (−10 to No. 35, despite beating Georgia State 49-22).
Last week's report card
I picked 33 of 52 winners in week 7 (63%). Vegas favorites went 37 of 52. Worst miss: I gave Georgia an 89% chance, and Auburn won by 3. Full results are in the track record.
Playoff picture
The 12 teams most likely to make the field, then the next four. From 10,000 simulations of the rest of the season, conference title games and the bracket.
| Team | Projected | Conf. title | Playoff | National title |
|---|---|---|---|---|
| Notre Dame | 10.4-1.6 | n/a | 97% | 20% |
| Miami | 10.9-1.1 | 72% | 92% | 15% |
| Alabama | 9.1-2.9 | 19% | 85% | 11% |
| Georgia | 9.8-2.2 | 33% | 78% | 9% |
| LSU | 8.5-3.5 | 13% | 71% | 10% |
| Ohio State | 9.5-2.5 | 37% | 70% | 7% |
| Indiana | 10.1-1.9 | 24% | 66% | 4% |
| BYU | 10.5-1.5 | 29% | 65% | 4% |
| Texas Tech | 10.5-1.5 | 30% | 55% | 3% |
| Utah | 10.1-1.9 | 25% | 52% | 3% |
| Ole Miss | 9.1-2.9 | 13% | 51% | 3% |
| UCLA | 10.8-1.2 | 24% | 49% | 2% |
| First four out | ||||
| Boise State | 9.1-1.9* | 56% | 47% | <1% |
| Tennessee | 9.2-2.8 | 12% | 44% | 2% |
| Texas | 7.7-4.3 | 2% | 43% | 2% |
| James Madison | 11.3-0.7 | 64% | 33% | <1% |
The Group of 6 bid: the highest-ranked team from the American, Conference USA, the MAC, the Mountain West, the Pac-12 and the Sun Belt gets in, champion or not (new for 2026). Leading that race: Boise State (47% to make the field), James Madison (33% to make the field), Oregon State (7% to make the field).
* Boise State has fewer than 12 games on the schedule in our data source, so the projection covers only those.
To pick the field, each simulation ranks teams roughly the way the committee does: rating, minus about 5 points per loss, plus schedule strength and a small bump for conference champions. Nobody can model the committee exactly, so treat the odds for teams with tough schedules as rough.
Week 8 picks for the other big games
| Game (model ranks) | Kickoff (ET) | Model | Win % | Vegas |
|---|---|---|---|---|
| No. 17 Houston at No. 9 Utah | Sat 12 a.m. | Utah by 4.9 | 62% | Utah by 6.5 |
| No. 19 Iowa at Minnesota The Floyd of Rosedale game | Sat 12 a.m. | Iowa by 12.7 | 79% | Iowa by 6 |
| Pittsburgh at No. 2 Miami | Sat noon | Miami by 21.8 | 91% | Miami by 23.5 |
| No. 4 LSU at Auburn | Sat noon | LSU by 11.7 | 77% | LSU by 7 |
| No. 7 Indiana at Michigan | Sat noon, Fox | Indiana by 10.8 | 75% | Indiana by 8.5 |
| Texas A&M at No. 3 Alabama | Sat 3:30 p.m., ABC | Alabama by 16.9 | 85% | Alabama by 15.5 |
Where I disagree with Vegas
The biggest gaps between my numbers and the betting line this week, in games with a ranked or Power 4 team. Don't read them as locks: from 2018 through 2025, when the gap was 6 points or more, the line ended up closer to the final margin 60% of the time (780 games). When the two picked different winners, I was right 51% of the time (488 games), about a coin flip. A big gap often means the line knows something I don't, like an injury.
- West Virginia at TCU: model TCU by 13.8; Vegas has TCU by 7. A 6.8-point gap.
- Iowa at Minnesota: model Iowa by 12.7; Vegas has Iowa by 6. A 6.7-point gap.
- Vanderbilt at Kentucky: model Kentucky by 18.1; Vegas has Kentucky by 11.5. A 6.6-point gap.
Week 7's best performances
From the box scores: passers ranked by adjusted yards per attempt (touchdowns add 20 yards, interceptions take away 45; 20+ attempts), runners and receivers by yards (15+ carries, 5+ catches).
- Passing: Michael Hawkins Jr., West Virginia: 25/33 for 464 yards, 3 TD, 0 INT (15.9 adjusted yards per attempt), in a 45-42 win over Cincinnati.
- Rushing: Torrance Burgess Jr., Texas State: 24 carries for 224 yards (9.3 a carry), in a 66-27 win over Colorado State.
- Receiving: Umari Hatcher, Syracuse: 13 catches for 224 yards, in a 34-26 loss to Louisville.
- Pass rush: Jayland McGlothen, San José State: 3.5 sacks (the most by any FBS player this week), in a 24-11 win over UTEP.
Most productive players (a Heisman watch by the numbers)
Who has added the most value this season: expected points (the EPA used above) added beyond what an average player would have produced on the same plays, adjusted for the defenses faced (garbage time excluded). It's not a Heisman prediction; voters weigh stats, team success and big moments, and quarterbacks dominate any list like this.
| Player | Team | Season | Points added above average | Plays |
|---|---|---|---|---|
| Conner Weigman | Houston | 1,770 passing yards, 20 TD, 2 INT | 138.5 | 253 |
| Jayden Maiava | USC | 2,045 passing yards, 18 TD, 3 INT | 119.9 | 231 |
| Josh Hoover | Indiana | 1,660 passing yards, 18 TD, 0 INT | 113.2 | 186 |
| Darian Mensah | Miami | 1,764 passing yards, 18 TD, 1 INT | 104.6 | 165 |
| Tayven Jackson | North Texas | 1,859 passing yards, 15 TD, 4 INT | 99.1 | 206 |
How this is made
Each team starts from a preseason rating (last season, recruiting, roster talent and coaching changes), and every game moves it toward what actually happened, using the final margin (blowouts count with diminishing returns) and play-by-play efficiency (EPA per play and success rate), with opponent strength built in and recent games counting a little more. The preseason rating fades as the season goes: it counts for less from week 7 and not at all from week 10, so by then the rankings come only from this season's games. A confirmed quarterback absence moves a team's rating by half the gap between the starter and his replacement (tested on 2024 and 2025); other injuries are flagged but not priced. Tested on 2018 through 2025 (2020 skipped) without peeking ahead, from week 4 on it missed final margins by 12.5 points on average and picked 73.0% of winners; the Vegas closing line missed by 12.1 and picked 72.8% (in weeks 1-3, when ratings lean on preseason expectations, the gap is wider: 13.3 vs. 12.3). Next week's edition grades these picks, misses included.
This post is generated automatically each week from the model's data. Every number in it is computed from play-by-play and box scores (via CollegeFootballData.com), and player numbers are checked against the official box score before they're used. The sentences come from templates I wrote, and any post can be edited by hand. I built the model and the automation with Claude as a pair programmer; the choices about what to measure and what to say are mine.